
4Q’16 Electronic Equipment Supply Chain Updated Growth Estimates
As more companies have released their 4Q’16 financial results we now estimate that revenues grew 3.3% in 4Q’16 vs. 4Q’15 (Chart 1). Chart 2 show estimated growth by sector.
Note that these estimates are still very preliminary as many companies have not yet reported including large ones such as HP & HP Enterprise, Dell, Lenovo, Cisco, Medtronic and Applied Materials.
Source: Company financial reports analyzed by Custer Consulting Group
Taiwan/China Update
January monthly revenues have just been reported by Taiwan-listed companies, many of which manufacture in China:
- January 2017 electronic equipment sales were up 4% compared to January 2016 but down sequentially 22% compared to December 2016. The normal winter seasonal slowdown is now well underway (Chart 3).
- ODM revenues mirrored those of electronic equipment. January 2017 sales were up 3.6% vs. January 2016 but down 20.4% sequentially from December 2016 (Chart 4).
- Wafer foundry revenues continued to drop (Chart 5). This suggests that global semiconductor shipments will drop in January (Chart 6). It appears that world semiconductor growth has peaked (Chart 7).
- Semiconductor shipment growth to Asia is well in excess of electronic equipment growth, also suggesting that a downward correction will soon occur (Chart 8).
- Package & test revenues declined (Chart 9) and so did passives (Chart 10).
- Memory revenues dipped only slightly, possibly due to firmer pricing.
- Rigid & flex printed circuit board sales dropped, in line with the seasonal downturn (Chart 12) and rigid (CCL) laminate partially followed the PCB decline (Chart 13).
Source: Company financial reports analyzed by Custer Consulting Group
U.S. “Factory Orders”
The U.S. Department of Commerce released December shipments, orders and inventories for domestically manufactured goods.
- Electronic equipment orders rose more than shipments (Chart 14).
- Order growth occurred sequentially in all sectors except computer hardware (Chart 15).
- Vehicle shipments increased modestly from December (Chart 16).
- Aircraft shipments rose very slightly from December but generally are on a downward trajectory (Chart 17)
- Defense capital goods orders dropped sharply (Chart 18) but military electronics bookings improved (Chart 19).
- Electromedical, measurement & control equipment orders were flat compared to December but are on a long term increasing trend (Chart 20).
- Semiconductor shipments to N America again exceed end market (electronic equipment shipment) demand on a 3/12 growth basis suggesting that a downward semiconductor shipment correction must occur soon (Chart 21).
- Passive component orders and shipments continued to expand (Chart 22).
Charts 23 and 24 summarize the growth of the domestic electronic supply chain on both a 12/12 (annualized) and 3/12 (3 month) basis and also 4Q’16 vs. 4Q’15.
Source: www.census.gov/indicator/www/m3/
Almost 3 Million Personal and Commercial Drones Will Be Shipped in 2017 (Charts 25 & 26)
Delivery Drones Will Comprise Less Than 1% of the Commercial Market by 2020
Production of drones for personal and commercial use is growing rapidly, with global market revenue expected to increase 34% to reach more than $6 billion in 2017 and grow to more than $11.2 billion by 2020, according to a new forecast from Gartner, Inc. Almost three million drones will be produced in 2017, 39% more than in 2016.
While the civil markets (personal and commercial) have been wading through regulation by various governments, drones' popularity in these markets has not diminished. The overall drone market will see substantial growth, but the dynamics of the personal and commercial submarkets are very different, Gartner analysts said.
Personal drones will continue to increase in popularity as an affordable extension of consumers' smartphones for taking photographs and selfies and for other entertainment options. They can fly a short distance and time, typically no more than 5,000 meters and for one hour, with flight height constrained to within 500 meters. They weigh less than 2 kilograms and are priced less than $5,000.
The market for commercial drones is much smaller, with a significantly higher average selling price in comparison with personal drones. With more countries solidifying their drone regulations, the market is beginning to stabilize, and companies are now buying drones to test and deploy in nearly every industry. Commercial drones normally have a higher payload, longer flight times, and redundant sensors and flight controllers to make them safer. They are more specialized to a function, such as mapping, delivery or industrial inspection, so prices vary according to these requirements.
"The commercial and personal drone markets are increasingly overlapping, as lower-priced personal devices are being used for commercial ventures," said Gerald Van Hoy, senior research analyst at Gartner. "Personal drone vendors are now aggressively trying to position themselves in the commercial market. Recent technological advances blur the lines, allowing personal drones to be used in many special-purpose applications such as surveillance, 3D mapping and modeling."
In commercial markets, new case studies are released regularly, showing savings in both costs and time, as well as highlighting increased accuracy and quality.
Agriculture was considered to be the first big commercial drone market, but pricing and economic dynamics around tighter yields and returns on investment mean that the commercial agricultural drone market is not growing at the pace of other commercial drone markets. Gartner predicts that through 2020, the high cost sensitivity of the agriculture market will limit drone adoption to 7% of commercial market growth.
Industrial inspections have been much more successful, primarily in oil and gas, energy, infrastructure and transportation. Regulations do not have as much of an impact on the market as was originally thought. Most inspections are close (within three meters) and low since they are examining equipment that is near or on the ground. Gartner expects the inspection segment to dominate with 30% of the commercial drone market through 2020.
Delivery drones continue to capture the attention of the news media but will not be a major factor for several years. The return on investment has not been proven either in regard to the cost of the drone, operational costs and a single customer delivery.
"Delivery drones will be mired in logistical issues like the time needed to return a drone to its origin point after delivery, and will amount to less than 1% of the commercial market by 2020," said Mr. Van Hoy. "We expect that delivery drones will begin finding a niche in business-to-business applications first, particularly for internal services within one company where logistics will not be such a big factor."
Source: www.gartner.com
Smartphone market up 6.6% year-on-year in 2016 (Charts 27 & 28)
Global smartphone demand totaled 391 million units in 4Q’16, up six percent year-on-year. North America returned to growth in the final quarter of the year, spurred on by flagship device launches and aggressive operator promotions. Despite strong demand in Great Britain during Black Friday promotions, sales in Western Europe fell four percent year-on-year in 4Q’16.
Based on GfK’s Point of Sales data, smartphone demand totaled 1.41 billion units in 2016, in line with GfK’s previously projected figures. Looking ahead, GfK forecasts global smartphone growth in 2017 to moderate to five percent year-on-year, with total demand reaching 1.48 billion.
Arndt Polifke, Global Director of telecom research at GfK, comments, “There is no other technology product that is as intensively used by consumers as the smartphone. As a result, smartphone demand remains stable even in saturated markets. Spurred on by the impressive range of exciting innovations, such as virtual reality, artificial intelligence, smart home functionality, mobile payments and mobile health, smartphones are going to gain further relevance for consumers in developed markets. On top of this, developing regions such as the Middle East/Africa and Emerging Asia have yet to mature and as such still have significant potential for growth. These two factors lead to a solid growth outlook for smartphone demand in 2017.”
Source: www.gfk.com
Worldwide connected things endpoint spending will increase 31% y/y to almost $1.7 trillion for 8.4 billion units in 2017 and expand to $3 trillion for 20.4 billion units in 2020 (Charts 29 & 30).
Consumer Applications to Represent 63% of Total IoT Applications in 2017
Gartner, Inc. forecasts that 8.4 billion connected things will be in use worldwide in 2017, up 31% from 2016, and will reach 20.4 billion by 2020. Total spending on endpoints and services will reach almost $2 trillion in 2017.
Regionally, Greater China, North America and Western Europe are driving the use of connected things and the three regions together will represent 67% of the overall Internet of Things (IoT) installed base in 2017.
Consumer Applications to Represent 63% of Total IoT Applications in 2017
The consumer segment is the largest user of connected things with 5.2 billion units in 2017, which represents 63% of the overall number of applications in use Businesses are on pace to employ 3.1 billion connected things in 2017. "Aside from automotive systems, the applications that will be most in use by consumers will be smart TVs and digital set-top boxes, while smart electric meters and commercial security cameras will be most in use by businesses," said Peter Middleton, research director at Gartner.
In addition to smart meters, applications tailored to specific industry verticals (including manufacturing field devices, process sensors for electrical generating plants and real-time location devices for healthcare) will drive the use of connected things among businesses through 2017, with 1.6 billion units deployed. However, from 2018 onwards, cross-industry devices, such as those targeted at smart buildings (including LED lighting, HVAC and physical security systems) will take the lead as connectivity is driven into higher-volume, lower cost devices. In 2020, cross-industry devices will reach 4.4 billion units, while vertical-specific devices will amount to 3.2 billion units.
Business IoT Spending to Represent 57% of Overall IoT Spending in 2017
While consumers purchase more devices, businesses spend more. In 2017, in terms of hardware spending, the use of connected things among businesses will drive $964 billion. Consumer applications will amount to $725 billion in 2017. By 2020, hardware spending from both segments will reach almost $3 trillion.
"IoT services are central to the rise in IoT devices," said Denise Rueb, research director at Gartner. Total IoT services spending (professional, consumer and connectivity services) is on pace to reach $273 billion in 2017.
"Services are dominated by the professional IoT-operational technology category in which providers assist businesses in designing, implementing and operating IoT systems," added Ms. Rueb. "However, connectivity services and consumer services will grow at a faster pace. Consumer IoT services are newer and growing off a small base. Similarly, connectivity services are growing robustly as costs drop, and new applications emerge."
Source: www.gartner.com
Annual Silicon Volume Shipments Remain at Record Highs (Charts 31 & 32)
Revenues continue to be under pressure
Worldwide silicon wafer area shipments increased 3% in 2016 when compared to 2015 area shipments according to the SEMI Silicon Manufacturers Group (SMG) in its year-end analysis of the silicon wafer industry, while worldwide silicon revenues increased by 1% in 2016 compared to 2015.
Silicon wafer area shipments in 2016 totaled 10,738 million square inches (MSI), up from the previous market high of 10,434 million square inches shipped during 2015. Revenues totaled $7.21 billion, one percent higher from the $7.15 billion posted in 2015. "Annual semiconductor silicon volume shipments reached record levels for the third year in a row,” said Chungwei (C.W.) Lee, chairman SEMI SMG and Corporate Development VP of GlobalWafers. "However, despite historical shipment highs, the same cannot be said about silicon revenue. The market remains well below pre-downturn levels."
Silicon wafers are the fundamental building material for semiconductors, which in turn, are vital components of virtually all electronics goods, including computers, telecommunications products, and consumer electronics. The highly engineered thin round disks are produced in various diameters (from one inch to 12 inches) and serve as the substrate material on which most semiconductor devices or "chips" are fabricated.
All data cited in this release is inclusive of polished silicon wafers, including virgin test wafers and epitaxial silicon wafers, as well as non-polished silicon wafers shipped by the wafer manufacturers to the end-users.
Source: www.semi.org
Apple shipped 6 million smartwatches in 4Q’16 and 11.9 million smartwatches in FY’16
Apple shipped six million smartwatches in the fourth quarter of 2016, the company's new quarterly shipment record for the smart device segment, according to Canalys.
The Apple Watch generated more than US$2.6 billion in revenues for Apple in the fourth quarter of 2016, making up nearly 80% of total global smartwatch revenues, Canalys noted.
Driven by Apple's strong performance, global smartwatch shipments reached nine million units in the fourth quarter of 2016, increasing 12% from a year earlier.
Canalys also estimated that Apple shipped 11.9 million smartwatches in 2016, holding a 50% market share globally for the year.
Xiaomi also enjoyed a record quarter shipping a total of 5.5 million Mi Band bracelets in the quarter.
In the coming quarters, Samsung Electronics is expected to push shipments of its Gear S3 Classic and Frontier. Also, Android Wear shipment volumes will bounce back significantly, as new products that were postponed due to the delay of Android Wear 2.0 will be launched soon, Canalys commented.
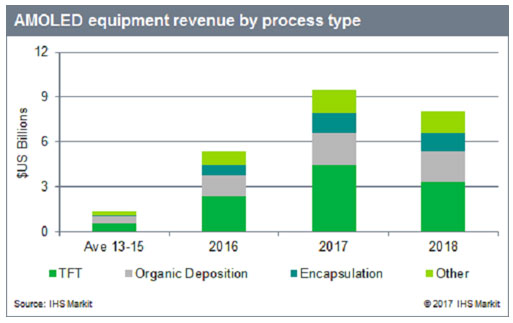
AMOLED production equipment purchases to reach record US$9.5 billion in 2017
The flat-panel display (FPD) industry is in the midst of a historic wave of building new factories to manufacture active matrix organic light emitting diode (AMOLED) displays. This will drive $9.5 billion worth of AMOLED-specific production equipment purchases in 2017, according to IHS Markit.
According to the IHS Markit Display Supply Demand & Equipment Tracker, the equipment used for producing TFT backplanes will account for 47% of the total market in 2017, worth $4.4 billion in revenues. Organic light-emitting layer deposition and encapsulation tools will generate record revenues of $2.2 billion and $1.2 billion, respectively, this year.
“A variety of approaches can be used to deposit OLED materials. However, fine metal mask (FMM) evaporation tools, used for high-resolution mobile display production, account for the majority of the deposition equipment revenue in the current wave of new factory construction,” said Charles Annis, Senior Director at IHS Markit.
Evaporation machines are technically highly complicated, consisting of multiple cluster vacuum tools linked by robots. Each tool consists of evaporation sources and mask-docking capabilities, and requires substantial pumping systems. The tools are typically very large and can exceed 100 meters in length at a high-volume production factory. This subsequently requires significant capital outlays.
“The market for high-performance AMOLED deposition equipment is dominated by Canon Tokki, which accounted for over half of the market in 2016,” Annis said. “At least five other evaporation makers are rushing to take advantage of the explosive market opportunity. However, with strong panel maker interest in Canon Tokki’s unrivaled mass production experience, we expect the company to make further market share gains in 2017.”
AMOLEDs also require high-performance encapsulation to prevent sensitive organic light-emitting materials from environmental degradation. Encapsulation barriers are typically fabricated from metal, glass or stacks of thin films. However, a substantial share of the new AMOLED factories now under construction will target production of plastic, flexible displays, which rely on cost intensive, multi-layer thin film encapsulation (TFE).
“Flexible AMOLED makers have done an incredible job simplifying their TFE structures over the past several years. Even so, the productivity of depositing high-quality inorganic films and printing organic layers all in a closed environment remains a complicated challenge,” Annis said. “The requirement of a large number of deposition chambers and auxiliary tools make TFE lines one of the largest segments of the AMOLED equipment market.”
With an estimated $23 billion of expenditures on AMOLED production equipment between 2016 and 2018, equipment makers, particularly those offering deposition and encapsulation solutions, will be enjoying a historic sales opportunity.
The IHS Markit Display Supply Demand & Equipment Tracker covers metrics used to evaluate supply, demand and capital spending for all major FPD technologies and applications.
Source: www.IHS.com
