Total reported sales for all switch categories in North America for Q2 of 2015 were about equal to the previous quarter and 1% below the second quarter of 2014. Sales units for Q2 2015 came in 5% above Q1 2015 and 3% less than Q2 of 2014.
The total booking dollars reported for all switch categories in North America for Q2 2015 ran 5% lower than the previous quarter and below Q2 2014 by 7%. The first quarter’s book-to-bill ratio for dollars was 0.928. Booking units in Q2 2015 were up 16% from Q1. The first quarter’s book-to-bill ratio for units was 0.921.
The second quarter versus the first showed total sales dollars inched up less than 1% and units 5% higher with mixed results. Prices were down 4% in total with all but two categories declining. The comparison to the second quarter of 2014 yielded similar results dollars up in five of eight categories but by less than 1% in total. Units were up for most categories but down in total by 3% due to tact switches. Pricing from a year ago was down in five of eight categories but higher in total by 3%. Year to date versus a year ago has dollars unchanged in total with losses in all but three categories. All in, units decreased 3% driven by snap and tact performance. The ASP gained 3% on a mix shift to higher priced switches as all but one category moved down.
Sales Growth by Switch Category
| Q2 2015 Versus Q1 2015 | Q2 2015 Versus Q2 2014 | YTD CY2015 Versus YTD CY 2014 |
|||||||
| Category | Dollars | Units | ASP | Dollars | Units | ASP | Dollars | Units | ASP |
| DIP | -8.1% | -1.0% | -7.1% | 0.6% | 5.9% | -5.1 | 12.3% | 12.8% | -0.4% |
| Keylock | 28.7% | 34.2% | -4.2 % | 11.8% | 22.1% | -8.5% | -3.3% | 12.2% | -14.2% |
| Push Button | 15.0% | -2.2% | 17.6% | 6.6% | 9.5% | -2.7% | 6.9% | 14.8% | -6.7% |
| Rocker | 10.0% | 14.8% | -4.2% | 0.0% | 10.9% | -9.8% | -3.2% | -2.1% | -1.6% |
| Slide | -4.0% | 12.8% | -15.0% | -4.0% | 17.4% | -18.3% | -3.9% | 12.5% | -14.6% |
| Snap Action | -4.5% | -6.4% | 2.0% | 4.0% | 0.7% | 3.3% | -5.0% | -5.4% | 0.6% |
| Tact | 3.2% | 8.9% | -5.3% | -9.0% | -9.9% | 1.1% | -6.9% | -10.8% | 4.3% |
| Toggle | -2.3% | 4.6% | -6.6% | -3.0% | -14.1% | 12.9% | 3.2% | -15.0% | -21.4% |
| Total | 0.6% | 4.8% | -4.0% | 0.7% | -2.7% | 3.5% | 0.0% | -2.8% | 2.8% |
When compared to last quarter total booking dollars decreased by 5%. Units were up in four of eight categories and 16% in total driven by tact switches. Booked prices fell 18% with decreases in all categories. Booked dollars in Q2 against the same quarter of 2014 were down for most categories and in total by 7%. Units were also down for most categories and 5% in total. Prices were lower for half of the categories and 2% overall. Bookings year to date versus 2014 were down in total dollars and units. Dollars are down 2% and units 9% off. Booking price slipped 8% with over half the categories down.
Bookings Growth by Switch Categories
| Q2 2015 Versus Q1 2015 | Q2 2015 Versus Q2 2014 | YTD CY2015 Versus YTD CY 2014 |
|||||||
| Category | Dollars | Units | ABP | Dollars | Units | ABP | Dollars | Units | ABP |
| DIP | 9.9% | 12.9% | -2.6% | -9.7% | -13.3% | 4.2% | -6.6% | -11.8% | 6.0% |
| Keylock | -7.3% | -5.5% | -1.9 % | -14.2% | -18.9% | 5.7% | 7.2% | 18.1% | -17.9% |
| Push Button | -3.1% | -1.8% | -1.3% | -3.8% | -19.3% | 19.2% | -0.7% | -12.8% | 13.5% |
| Rocker | -12.8% | -1.5% | -11.4% | 3.6% | 11.1% | -6.7% | 13.5% | 15.0% | -1.3% |
| Slide | -16.0% | 1.9% | -17.5% | -18.4% | 11.8% | -27.0% | -13.1% | 9.4% | -20.5% |
| Snap Action | -4.5% | 4.2% | -8.3% | -5.1% | -3.9% | -1.3% | -4.2% | -1.9% | -2.6% |
| Tact | 4.3% | 27.5% | -18.2% | -19.0% | -4.1% | -15.6% | -15.8% | -16.0% | 0.1% |
| Toggle | -13.6% | -1.1% | -12.7% | -11.4% | -22.7% | 14.6% | -3.5% | -21.8% | -23.3% |
| Total | -5.3% | 15.6% | -18.0% | -6.9% | -4.8% | -2.3% | -1.6% | -8.7% | 7.7% |
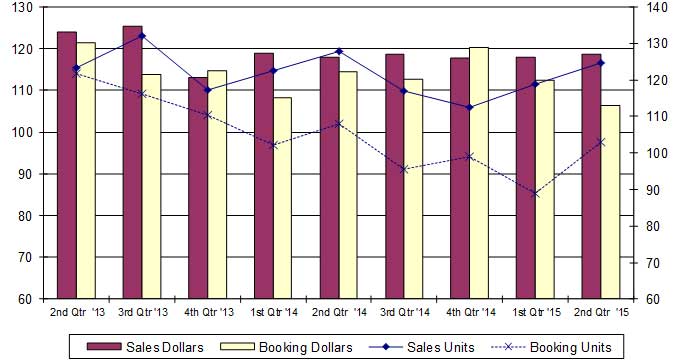
The graph below shows total quarterly indexed sales and bookings in dollars and units for the reported data since Q2 CY 2013. All measures set two-year highs Q2 and Q3 0f 2013 and had been improving over the previous three quarters. In Q3 of 2013, sales measures continued to improve as booking measures eased down the next three quarters and improved in Q2 of 2014. In Q4 of last year booking dollars were near a two year high. Sales measures dropped in Q4 of 2013 but rebounded in Q1 of 2014 only to slip the balance of last year and flat this year.
CY 2013/2015 Total Switch Sales & Bookings Index
(Q1 CY 2003 = 100)
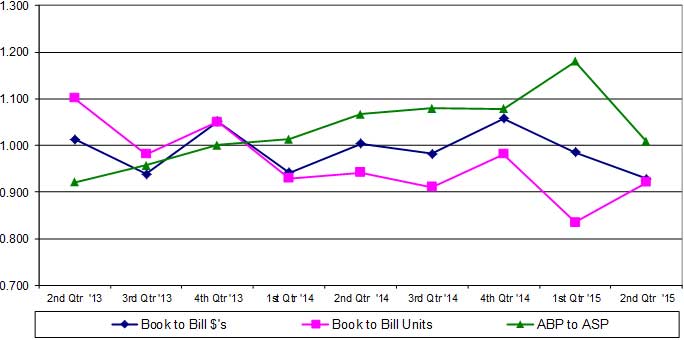
Book-to-bill units generally have trended lower over the last two years. Book-to-bill dollars have oscillated above and below 1.0 over the last two years. The booking to selling price ratio has trended higher over the past two years.
CY 2013/2015 Ratios for Total DIP, Keylock, Push Button, Rocker, Slide,
Snap Action, Tact, & Toggle Reported Switch Market
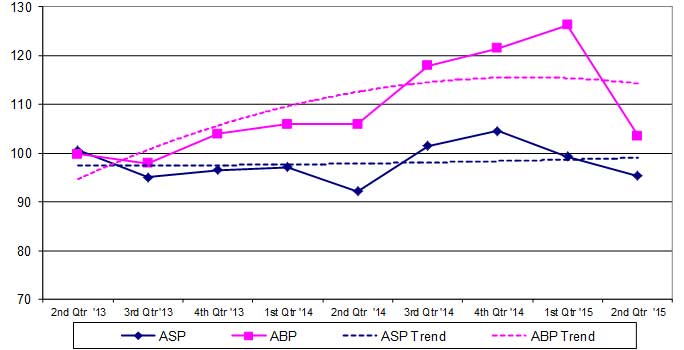
Indexed booking prices general increased over the last two years to a peak in Q1 and fell dramatically last quarter. Indexed selling prices improved until the start of this year and have declined the last two quarters.
CY 2013/2015 Price Index Total Switch
Market (Q1 CY 2003 = 100)