Introduction
For the past 30 years, Paumanok Publications, Inc., has viewed the global market for capacitors on an annual basis based on the traditional methodology of the volume of units shipped by dielectric and their respective value of consumption. However, in this MarketEYE installment, we view the market based on annual demand for capacitance in microfarads as well make an estimate for the cumulative amount of capacitance that has been installed between 1990 and 2018.
Paumanok Publications, Inc. is in a unique position to generate useful data that shows the past long term trends in global capacitance requirements but further suggests a roadmap for capacitance – the ability to store an electrical charge. and why today it is in short supply.
Methodology
For this exercise, Paumanok IMR reviewed numerous studies on the capacitor market going back to 1990, and created spreadsheets showing production by component “case size” over time. Subsequently Paumanok created an average capacitance value per “case size” over the 28-year time period. This MarketEYE exercise revealed that at specific intervals, the capacitance value per cubic centimeter of engineered dielectric material primarily multi-layered ceramic chip capacitor materials (MLCC) and tantalum chip capacitors, increased due to remarkable advances in the processing of raw materials.
Moreover, we took into account the thinner gage plastic dielectric films (OPP, PET, PEN, PPS) and thinner gage anode and cathode foils impacting capacitance in plastic film and aluminum electrolytic capacitors respectively.
Substantial Increases in Capacitance Requirements Over Time
One conclusion Paumanok was able to ascertain from this exercise is that the global requirement for capacitance has increased accordingly with the advancement of some important end-products. These include television sets, computers and wireless handsets; and while other product segments; such as telecom infrastructure equipment, automobiles, power supplies and lighting ballasts as well as various sub-products in the consumer audio and video imaging segment have had a major impact on global demand for capacitance, the combination of production volume of the end-product and the high amount of capacitance per board required in television sets, computers and handsets created a dramatic overall increase in the global requirements for capacitance between 1990 and 2018. This process is described in three steps and gives us future direction as well.
1) The First Shift: Makes Things Smaller (The Pioneer)
The most interesting time in the marketplace prior to 2017 had been the growth period for “net new capacitance in electronics” between 1996 and 2000 (4 years) and then the extended growth period between 2002 and 2008 (6 years), with each growth event followed by a drop in the requirement for net new capacitance due to brimming supply chains. During that time-period the chip capacitor accounted for 30% of the units of components consumed on all printed circuit boards. The first upward shift in chip capacitor demand involved the introduction of the cellular telephone, overlapping rapid movements in notebook computing and flat panel display technology in home theatre electronics.
2) The Second Shift: Makes Things Portable (The Early Settler)
The second shift, which occurred between 2007 and 2016 was the movement toward portability, which demanded more capacitance per cubic centimeter of capacitance (stacking), and this solution came in the form of the stacked multilayered ceramic chip capacitor (MLCC), and the volume of MLCC per PCB increased to 40% of the physical component volume (number of pieces and occupied real estate on the board increased sharply, but also the stacking capability of MLCC also increased in Japan, Korea and China).
Based on our detailed analysis, the movement toward portability in electronics had actually created a stagnation effect on the global requirement for capacitance. The reason why capacitance demand had leveled off on a global basis between 2007 and 2017 was because of a change in the consumer’s preference for end-products. The success and acceptance of the smartphone and the tablet, which require a relatively smaller capacitance signature when compared to the requirements of desktop computers, notebook computers and large screen TV sets, which require a large capacitance signature, and this caused the global demand for capacitance to plateau between 2010 and 2016 (See Graph 1.0).
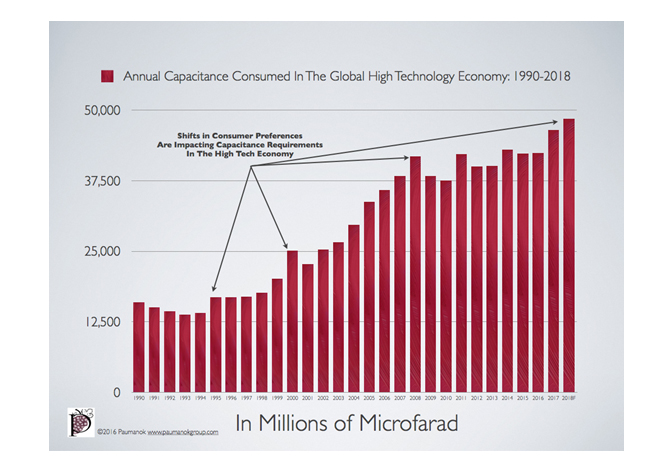
Source: ©2017 Paumanok Publications, Inc. All Rights Reserved. The chart illustrates the consumption of net new capacitance measured in millions of microfarads in electronic and electrical printed circuit boards during the measured time-period. The market moves into high gear when multiple end-markets are making next generation demands upon the supply chain.
3) The Third Shift Connects Them All Together (The Infrastructure)
Since 2017 the capacitance requirements again are increasing. Based on the Paumanok Methodology, we note there is both a fundamental increase in the overall capacitance signature in the marketplace largely based on an increased requirement of capacitance value per cubic centimeter of smartphone, coupled with the beginning movement to finally connect automobiles to the infrastructure and to the environment. While most key engineering feats have been focused in automotive propulsion (i.e. hybrid and electric transport), the new focal point is for electronic consumption in the passenger compartment, with leading edge platforms for sensitivity (Radar, LIDAR, HUD) expected to lead toward autonomous driving.
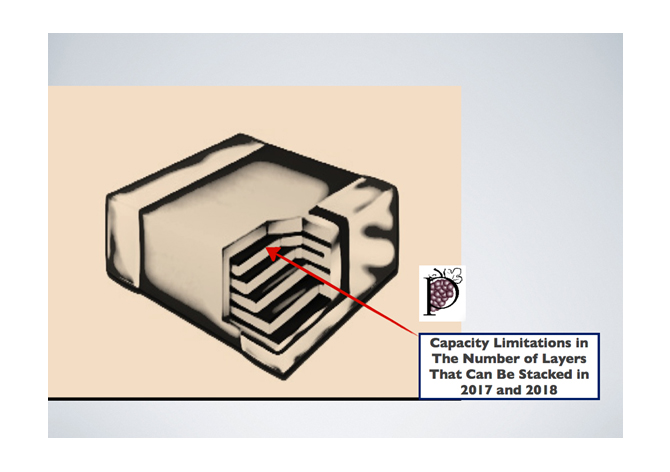
The capacitance requirements for a market that currently supports 100 million class 3 to 7 vehicles has suddenly shifted the global capacitance requirements upward yet again, and this has placed a strain on the capacity to produce stackable layers of ceramic as most customers are now designing in ultra-small case size MLCC at 100 microfarads and above as standard components, and this is placing restraints on the overall number of units that can be produced (See Figure 2)
Source: Passive Component Industry Magazine LLC (A Paumanok Company)
Certain Dielectrics Impact the Annual Capacitance Requirements More than Others
One of the primary maxims associated with capacitor development is that the physical size or available surface area of the capacitor is directly proportional to the capacitance value of the finished component. Therefore, what determines both the annual volume of capacitance sold, and the amount of the installed base for capacitance (See Graph 2.0); is the volume of capacitors sold by dielectric and the average amount of capacitance per capacitor.
Ceramic capacitors, for example, have a large quantity of pieces sold each year (in the trillions of pieces) but their overall capacitance value per unit is limited to less than 330 microfarad, and their average capacitance value is in the single-digit microfarad range.
Aluminum capacitors on the other hand, have a fraction of the shipment volume of ceramic capacitors, but have an extraordinarily high amount of capacitance per unit; therefore, it is the volume of aluminum electrolytic capacitors sold each year that largely determines the total amount of capacitance sold worldwide.
Tantalum capacitors also have an extremely high quantity of capacitance per unit, but their annual sales volume is much smaller than that of aluminum and ceramic capacitors. Plastic film capacitors have low capacitance per unit on average and a low comparative sales volume worldwide; and therefore contribute the least to the annual capacitance volume and installed capacitance base (plastic film capacitors are sold for their voltage handling capability and their unique smoothing characteristics).
The Growth in Capacitance Value Per Person
Finally, by comparing the growth in world population versus the estimates on net new capacitance consumption per year, we can make estimates on the global capacitance requirements per person over time. Graph 2.0 Shows World Population in Green and Installed Capacitance in Blue, the Sub-Chart Shows the Average Capacitance Requirements for Every Person on Earth, Rising from 2.2 Microfarad to 118 microfarad between 1990 and 2018.
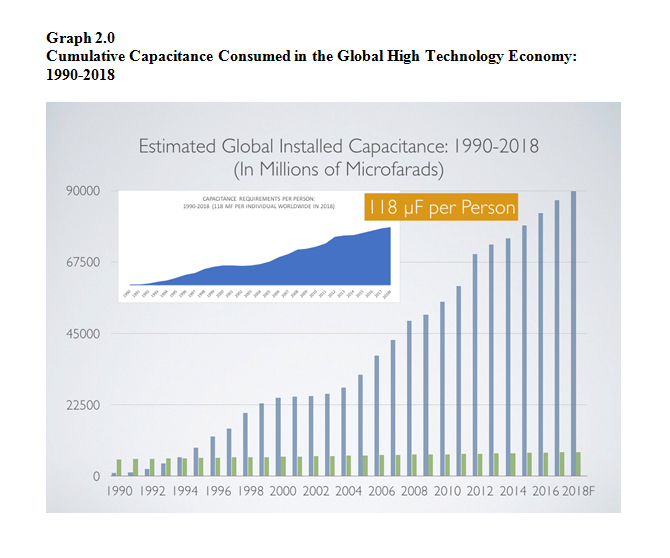
Source: ©2017 Paumanok Publications, Inc. All Rights Reserved. The Chart Above Shows World Population in Green and Installed Capacitance in Blue, the Sub-Chart Shows the Average Capacitance Requirements for Every Person on Earth, Rising from 2.2 Microfarad to 118 microfarad between 1990 and 2018.
1) The Growth in World Populations:
Between 1990 the world population increased from 5.33 billion people, in 1990 to an estimated 7.6 billion people in 2018, which represents a combined growth rate of 42.5% over 28 years. During that time period the process of electronic proliferation to the global masses grew rapidly and part of the underlying growth rate was penetration of electronics by world population.
2) The Growth in Capacitance Value Per Person:
Between 1990 and 2018, according to Paumanok estimates, the average requirement for capacitance per person in 1990 was 2.2 microfarads. This has grown to 118 microfarad per person at the beginning of 2018. This represents a cumulative growth rate of 5,263 percent over 28 years.
3) Critical Breakthroughs in Ceramics Processing Adds to Installed Capacitance Base:
Critical breakthroughs in raw material development for ceramic capacitors have contributed to the annualized increases in capacitance consumed in the high-tech economy worldwide. The development of advanced ceramic dielectric material processing using alk-oxide, hydrothermal and sol-gel techniques has been instrumental in increasing the average capacitance value per unit in MLCC.
Also, understanding that at the core of capacity expansion in ceramic chip capacitors is the number of stackable layers per chip; and this will help the reader further contemplate three-dimensional capacity limitations as opposed to two dimensional capacity limitations that have been traditionally based solely on unit output.
What the Future Holds
Based upon the thesis put forward, we can ascertain and forecast that capacitance value per person will increase over time, as will underlying growth in human population. Portability and increased hardware and software driven functionality will continue to drive up capacitance value per “black box” i.e. in smartphones, computers and home theatre electronics. This will continue to place great emphasis on demand for multilayered ceramic capacitors, especially those that can continue to achieve high capacitance in increasingly smaller case sizes by adding capacity to stack layers today, to serve the capacitance needs of the global population of tomorrow, which are estimated by Paumanok to increase to an estimated 200 microfarads by 2030.
