Total reported sales for all switch categories in North America for Q4 of 2016 were 3% below the previous quarter and 4% better than observed in the fourth quarter of 2015. Sales units for Q4 2016 came in 2% more than units sold in Q3 2016 and 8% above Q4 of 2015.
The total booking dollars reported for all switch categories in North America for Q4 2016 ran 4% less than the previous quarter and about equal to Q4 2015’s total bookings. The fourth quarter’s book-to-bill ratio for dollars was 0.999. Booking units in Q4 2016 were 6% below Q3. The first quarter’s book-to-bill ratio for units was 0.892.
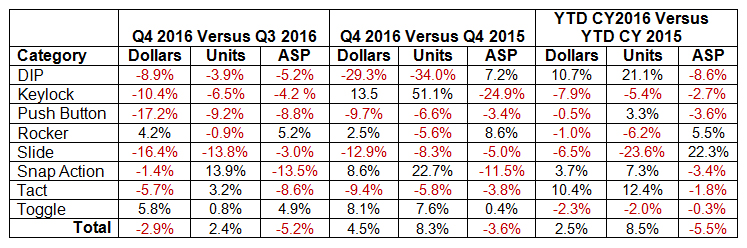
The fourth quarter versus the third shows total sales dollars down 3% on the weakness of the majority of categories. Units were also down for the majority categories but increased 2% in total on the strength of snap action and tact categories. Prices were down 5% in total with all but rocker and toggle decreasing. The comparison to the fourth quarter of 2015 has dollars and units increasing 4% and 8%. Half the categories saw dollars increase. Units were lower for most categories but rose in total on the strength of snap action and keylock categories. Pricing from a year ago was down in over half of the categories and lower in total by 4%. Year to date versus a year ago has dollars 2% higher in total driven by snap action and tact switches. All in, units jumped over 8% also driven by snap action and tact performance. The ASP dropped over 5% with losses in six of eight categories.
Sales Growth by Switch Category
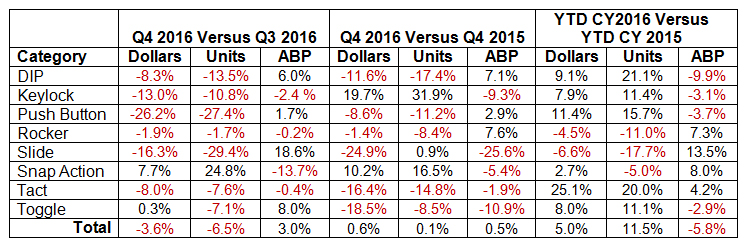
When compared to last quarter total booking dollars fell 4% and units were down 6% with the majority of types decreasing. Booked prices were up 3% in total with increases in the majority categories. Booked dollars, units, and booking price in Q4 against the same quarter of 2015 were nearly unchanged in total with mixed results by category. Bookings for 2016 versus 2015 were up in total dollars and units. Dollars are up 5% and units over 11% better. Booking price slipped 6% with over half the categories down.
Bookings Growth by Switch Category
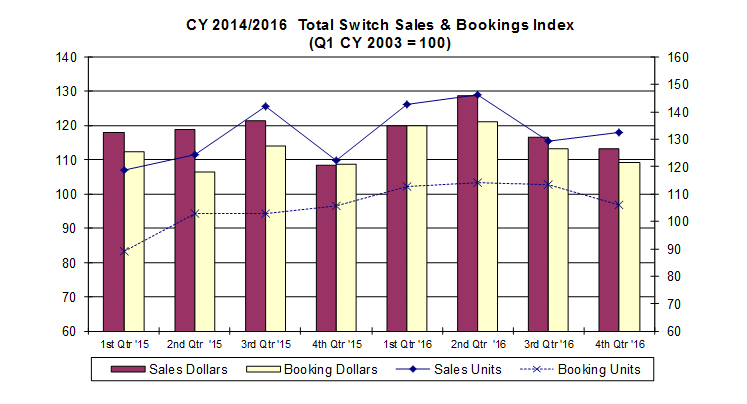
The graph below shows total quarterly indexed sales and bookings in dollars and units for the reported data since Q4 CY 2014. Indexed sales dollars remained flat and units dropped for the first three quarters of the period. Both indexed dollars and units improved in in Q2 and Q3 of 2015 then fell sharply in Q4. Both improved the first two quarters of last year then fell in Q3 and Q4. Booking units general fell to a low in Q1 2015 and have improved until the last two quarters. Booked dollars were mainly flat, except for Q2 and Q4 of 2015, then picked up in the first half 2016 and fell in the last two quarters.
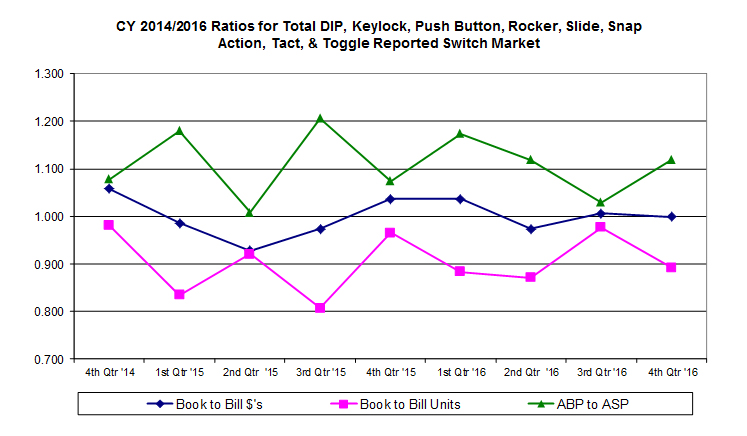
Book-to-bill units have been 1.0 for the last two years. Book-to-bill dollars have oscillated above and below 1.0 over the last two years. The booking to selling price ratio has been well above 1.0 for the period.
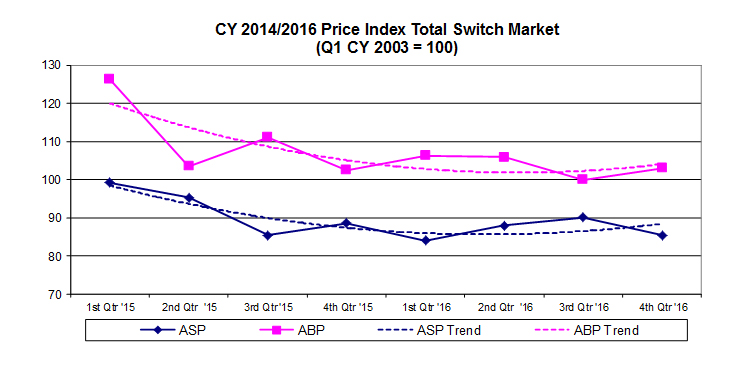
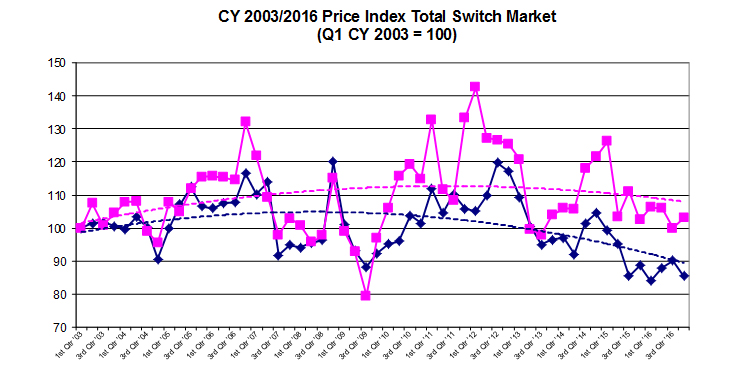
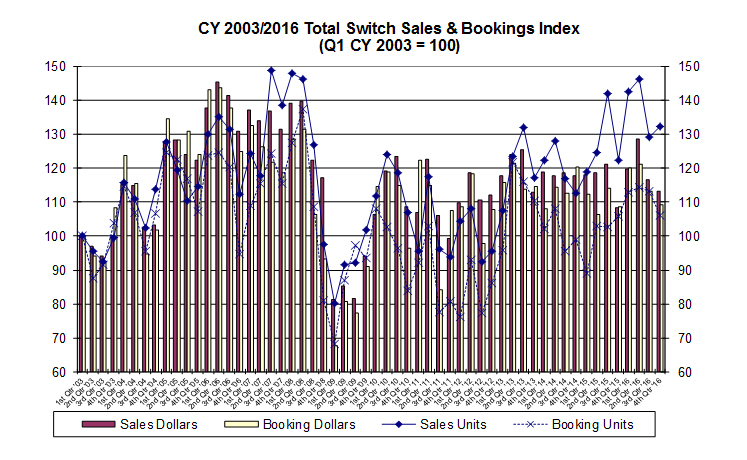
Indexed booking prices generally increased to a peak in Q1 of 2015 and fell dramatically the last seven quarters. Indexed selling prices improved until the start of 2015 and have generally declined since and is near a Switch Tracks all-time low as shown in the second graph below.