Total reported sales for all switch categories in Europe for Q1 of 2018 were 14% above the previous quarter and 4% better than first quarter of 2017. Sales units for Q1 2018 came in 14% more than units sold in Q4 and about 4% higher than Q1 2017.
The total booking euros reported for all switch categories in Europe for Q1 2018 ran 19% more than the previous quarter and above Q1 2017’s total bookings by 5%. The fourth quarter’s book-to-bill ratio for euros was 1.112. Booking units in Q1 2018 were up 11% from Q4 of last year. The fourth quarter’s book-to-bill ratio for units was 1.113.
The first quarter versus the fourth shows total euros and units were up 14%. The average selling prices (ASP) increased in the majority categories and were nearly unchanged in total. Q1 compared to a year ago shows gains in euros for five of eight types and a 4% rise in total. Units rose over 4% in total with increases in all but rockers. ASPs decreased for five of the eight categories and 1% in total.
Sales Growth by Switch Category
| Q1 2018 Versus Q4 2017 | Q1 2018 Versus Q1 2017 | |||||
|---|---|---|---|---|---|---|
| Category | Euros | Units | ASP | Euros | Units | ASP |
| DIP | 8.1% | 2.4% | 5.6% | 14.2% | 2.8% | 11.1% |
| Keylock | 11.1% | 21.0% | -8.2% | 10.8% | 25.0% | -11.4% |
| Push Button | -8.4% | 8.7% | -15.7% | -4.7% | 5.0% | -9.2% |
| Rocker | -6.9% | -13.3% | 7.3% | -13.3% | -21.6% | 10.5% |
| Slide | 7.1% | 1.5% | 5.5% | 8.2% | 0.8% | 7.4% |
| Snap Action | 22.6% | 19.8% | 2.3% | 8.8% | 5.2% | 3.4% |
| Tact | 12.0% | 14.8% | -2.4% | -11.1% | 5.4% | -15.7% |
| Toggle | 0.9% | -7.1% | 8.6% | 5.5% | 8.8% | -3.0% |
| Total | 14.1% | 14.3% | -0.2% | 3.6% | 4.4% | -0.7% |
When compared to the fouth quarter total bookings were up in euros and units for the majority of types. In total euros grew 19% and units up 11%. The average booking price rose 7% in total with the half of the categories increasing. Results compared to same quarter last year has euros and units increasing for the majority of categories. In total euros improved 5% and units rose 8% with the ABP declining 2%.
Bookings Growth by Switch Categories
| Q1 2018 Versus Q4 2017 | Q1 2018 Versus Q1 2017 | |||||
|---|---|---|---|---|---|---|
| Category | Euros | Units | ABP | Euros | Units | ABP |
| DIP | 19.8% | 49.1% | -19.7% | 10.8% | 7.4% | 3.2% |
| Keylock | 9.1% | 37.3% | -20.6% | 3.9% | 3.9% | -0.0% |
| Push Button | 17.7% | 32.6% | -11.2% | 6.2% | 3.8% | 2.3% |
| Rocker | 0.3% | -4.0% | 4.6% | 1.4% | 0.2% | 1.2% |
| Slide | 5.1% | 0.4% | 4.7% | 19.9% | 40.2% | -14.5% |
| Snap Action | 28.2% | 25.0% | 2.6% | 6.8% | 10.2% | -3.1% |
| Tact | -1.0% | -3.0% | 2.0% | -6.4% | 5.0% | -10.9% |
| Toggle | 10.8% | 14.4% | -3.1% | -0.5% | 2.4% | -2.8% |
| Total | 19.2% | 11.2% | 7.1% | 5.2% | 7.9% | -2.4% |
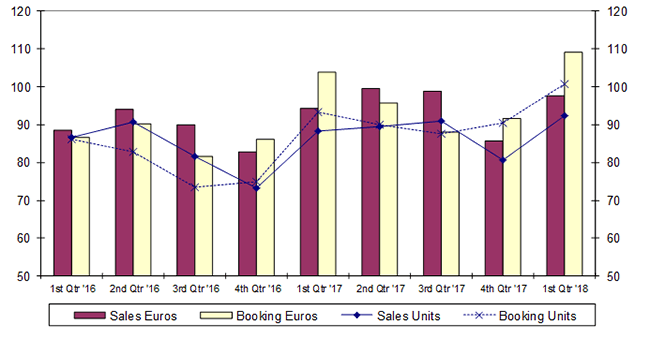
The graph below shows total quarterly indexed sales and bookings in euros and units for the reported data since Q1 CY 2016. In the last half of 2015 sales and booking metrics fell and Q1 of 2016 produced a significant improvement in all metrics followed by more growth in Q2. In the last two quarters of 2016 all metrics fell off but improved dramatically in 2017. In Q1 booking set 2 year highs, then fell the next 2 quarters and improved in the last quarter. Q1 starts with a new 2 year high in booked euros and units. Sales Euros set a two year high in Q2 of 2017 and moved lower the balance of the year. Sales units set a two year high in Q1 as dollars neared Q2 of last year.
CY 2016/2018 Total Reported European Switch
Sales & Bookings Indexed
(Q1 2007 = 100)
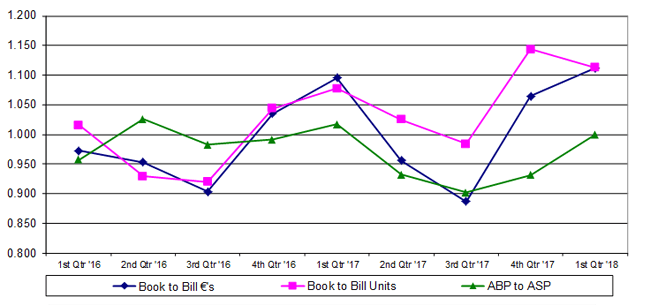
Book-to-bill euros and units were at a low in Q3 of 2016. Both metrics improved the next two quarters, fell in Q2 and Q3 of 20-17, and jumped higher the last two quarter. The ABP-to-ASP ratio has been below 1.0 for seven of the last nine quarters.
CY 2016/2018 Total Reported European Switch Market Ratios
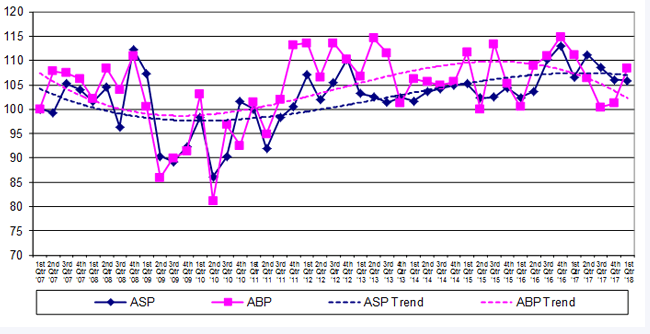
For the period, indexed booking and selling prices generally trended higher and set a two year high in Q4 of 2016. Booking price then steadily declined for three quarters and recovered the last two quarters while the selling price declined at a slower pace.
CY 2016/2018 Total Reported European Switch Price Index
(Q1 2007 = 100)
CY 2007/2018 Total Reported European Switch Price Index
(Q1 2007 = 100)